
Most revenue cycle dashboards report too many numbers and explain too few of them. By the time a metric turns red on a monthly review, the operational failure that caused it happened weeks earlier, and the cash impact is already in the system.
The most useful revenue cycle management metrics are not the ones that produce the longest reports. They are the ones that show quickly and specifically where revenue is slowing down, leaking out, or becoming harder to collect. In 2026, with denial rates climbing, payer adjudication becoming more aggressive, patient financial responsibility growing, and continued workforce pressures, accurate and timely diagnostic capability matters more than ever.
This guide covers the RCM KPIs that actually move the needle on financial performance. We explain how to interpret metrics in combination rather than in isolation, what current benchmarks look like, and where most organizations go wrong with tracking. It is written for revenue cycle leaders, CFOs, practice administrators, and billing managers who want their reporting to drive operational decisions, not just document outcomes after the fact.
Related Services
Explore how Pharmbills supports healthcare providers with expert Revenue Cycle Management Services for Healthcare.
Why Revenue Cycle KPIs Matter More Than Ever in 2026
The national average claim denial rate has reached approximately 12%, with 41% of providers reporting denials above 10% (both numbers that have worsened year over year since 2022). That single trend, combined with several others, is why revenue cycle KPIs can no longer be treated as a quarterly review exercise.
Several other pressures converging on revenue cycle operations include:
- Payer adjudication algorithms are flagging clinical inconsistencies, auto-downcoding claims, and issuing denials at scale.
- High-deductible health plan growth has shifted patient balances upward, with half of all US patients now carrying medical debt between $1,000 and $5,000.
- RCM teams are working understaffed, with 43% of providers reporting chronic shortages.
- Expectations around automation, real-time eligibility, and digital payment infrastructure have raised the operational bar across the board.
In this environment, revenue cycle management metrics function as more than financial indicators. They are operational signals that reveal where workflows are breaking down before the revenue impact shows up in the bank account.
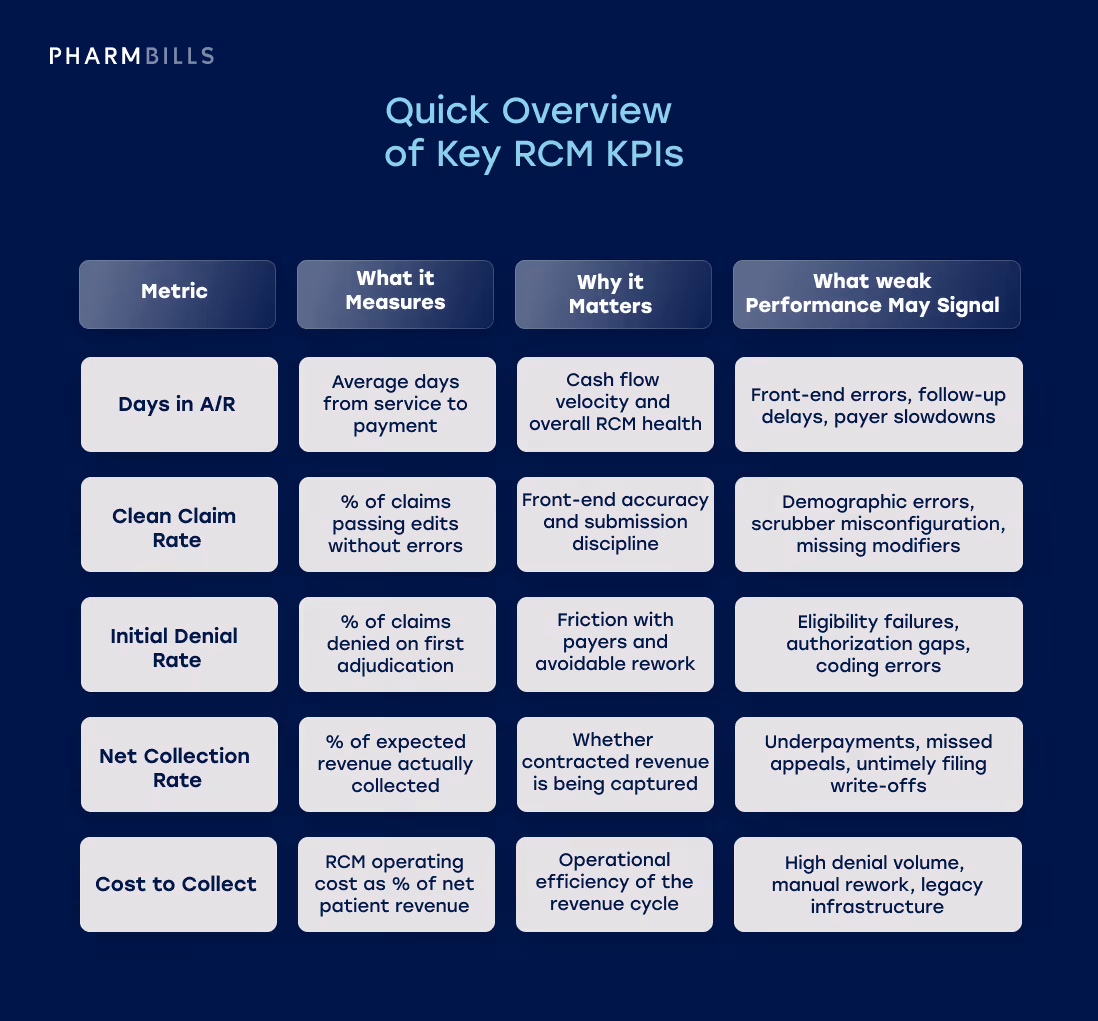
Quick Overview of Key RCM KPIs
The five healthcare billing KPIs below offer a quick-scan view of what high-performing organizations track most closely. These are the key metrics to track, and we provide a full and expanded list further on in the article.
Further Reading
For a foundational overview of how revenue cycle management works, see our guide to Understanding Revenue Cycle Management (RCM) and Why It's Important for Healthcare.
How to Think About Revenue Cycle KPIs Across the Full Workflow
A list of metrics is not the same thing as having an effective framework for using them. The best approach to revenue cycle analysis organizes KPIs by workflow stage, so that performance issues can be traced back to the part of the cycle where they originated (rather than reviewed as isolated data points).
Mapping KPIs to workflow stages helps reveal where breakdowns occur and which teams own the corresponding outcomes:
- Patient access and front-end accuracy. Metrics tied to scheduling, eligibility verification, prior authorization, and demographic capture. Failures here generate downstream denials and unrecoverable write-offs.
- Claims performance. Metrics that evaluate the quality and acceptance of submitted claims, including clean claim rate and first-pass resolution.
- Denials and rework. Metrics that track denial volume, root cause, and appeal outcomes, capturing both the financial and operational cost of preventable rejections.
- Accounts receivable and collections. Metrics that measure cash velocity and aging, including days in A/R, A/R over 90 days, and net collection rate.
- Financial outcomes and management visibility. Metrics that summarize overall yield, cost to collect, and bad debt — the ultimate test of whether the revenue cycle is performing as designed.
Read together, these stages form a connected system. For example, a spike in denials in stage 3 often traces back to weak verification in stage 1, and rising A/R days in stage 4 may reflect either upstream errors or back-end follow-up gaps.
RCM efficiency metrics are always strongest when reviewed as a connected sequence, not as a flat list.
Additional Insights
For a closer look at how billing and full-cycle revenue management differ in scope and metrics, see Medical Billing Services vs. Revenue Cycle Management: What's the Difference in 2026.
Core Revenue Cycle Management Metrics to Track
The eight RCM KPIs detailed below form the operational core of a serious revenue cycle reporting practice.
For each metric, we cover the standard definition, why it matters, what weak performance typically signals, and how high-performing teams use it in practice. Where benchmarks are available from HFMA MAP Keys or comparable industry sources, those targets are referenced.
Days in Accounts Receivable (A/R)
Days in A/R measures the average time elapsed between the delivery of clinical services and the receipt of corresponding payment. It is the single most cited indicator of cash flow velocity and overall revenue cycle health.
The HFMA MAP Keys benchmark sets the median for hospitals and health systems at 38.3 days, with top performers achieving 30.5 days. For physician practices, the median is significantly lower at 21.9 days. Independent practices generally target 35 days or fewer.
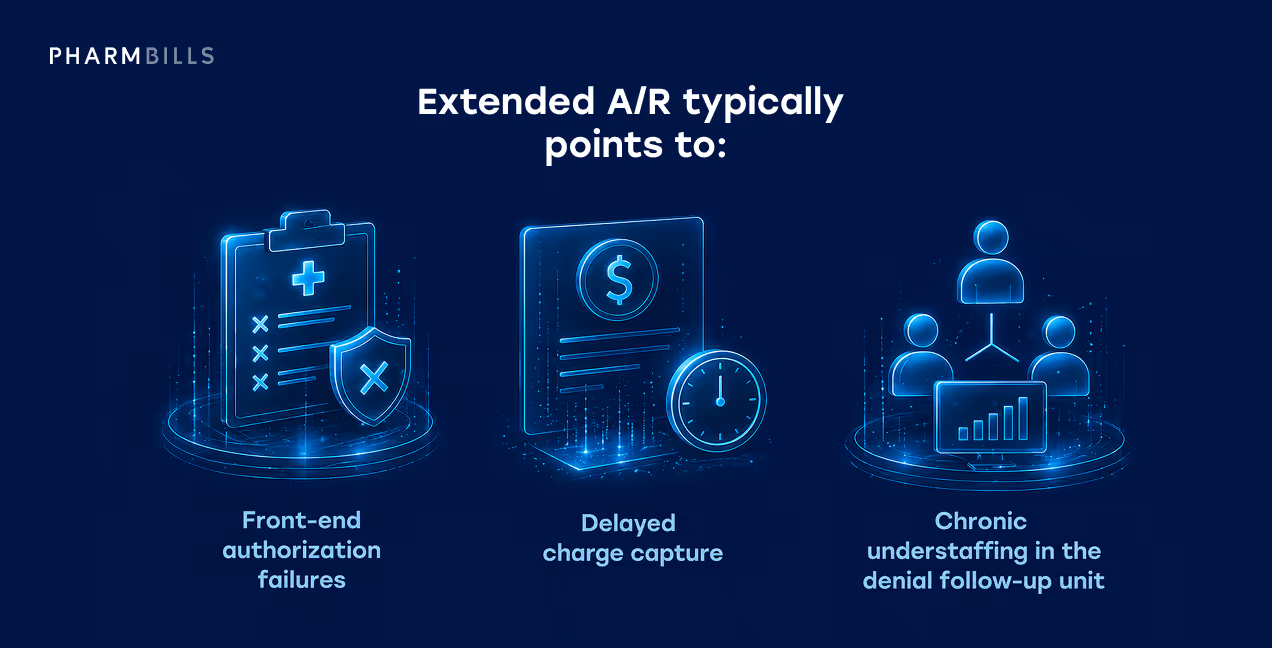
Extended A/R typically points to:
- Front-end authorization failures
- Delayed charge capture
- Chronic understaffing in the denial follow-up unit
As claims age past 60 days, the probability of full recovery drops sharply. Once payer timely-filing cutoffs are breached, earned revenue converts to permanent write-offs.
Practical tip: Average A/R days alone can mask aging tail risk. Always pair it with the A/R over 90 days metric covered later in this section.
Clean Claim Rate
The clean claim rate is a revenue cycle KPI that measures the percentage of claims that pass all payer edits and clearinghouse formatting checks at submission, without requiring manual intervention or rework. It is the cleanest indicator of front-end data capture quality and claim scrubber configuration.
Industry consensus targets a minimum of 95%, with high-performing organizations achieving 98% or higher. A low clean claim rate immediately points to front-end operations problems, such as demographic typos, invalid provider identifiers, outdated subscriber IDs, missing modifiers, or scrubbing rules that have not kept pace with payer changes.
One important calibration: A high clean claim rate is not the same as guaranteed payment. A "clean" claim has passed structural and formatting edits, but it has not been adjudicated. The next metric covered addresses that gap directly.
First-Pass Resolution Rate
The First-pass resolution rate (FPRR), sometimes called first-pass yield, measures the percentage of claims fully adjudicated and paid by the payer on the very first submission — no appeals, no documentation requests, no manual rework. The industry target is above 95%.
Just a small note on terminology. First-pass acceptance rate is sometimes used interchangeably with FPRR, but the two measure different things:
- First-Pass Acceptance Rate is functionally identical to clean claim rate above. It tracks claims that pass clearinghouse formatting edits and enter the payer's adjudication system.
- First-Pass Resolution Rate captures whether the claim was actually paid without rework.
The gap between these two RCM KPIs is diagnostically useful. A 98% acceptance rate combined with an 85% resolution rate signals that claims are structurally sound but failing on clinical, authorization or medical necessity grounds after submission. Maximizing FPRR is the ultimate operational target, as every percentage point drop translates directly into administrative rework cost.
Initial Denial Rate
The Initial Denial Rate quantifies how often payers refuse payment on a first adjudication pass. Industry-leading organizations target below 5%, with elite performers below 3%. The macroeconomic reality, however, is much more challenging: the national average sits at approximately 12%, and 41% of providers report denial rates exceeding 10%.
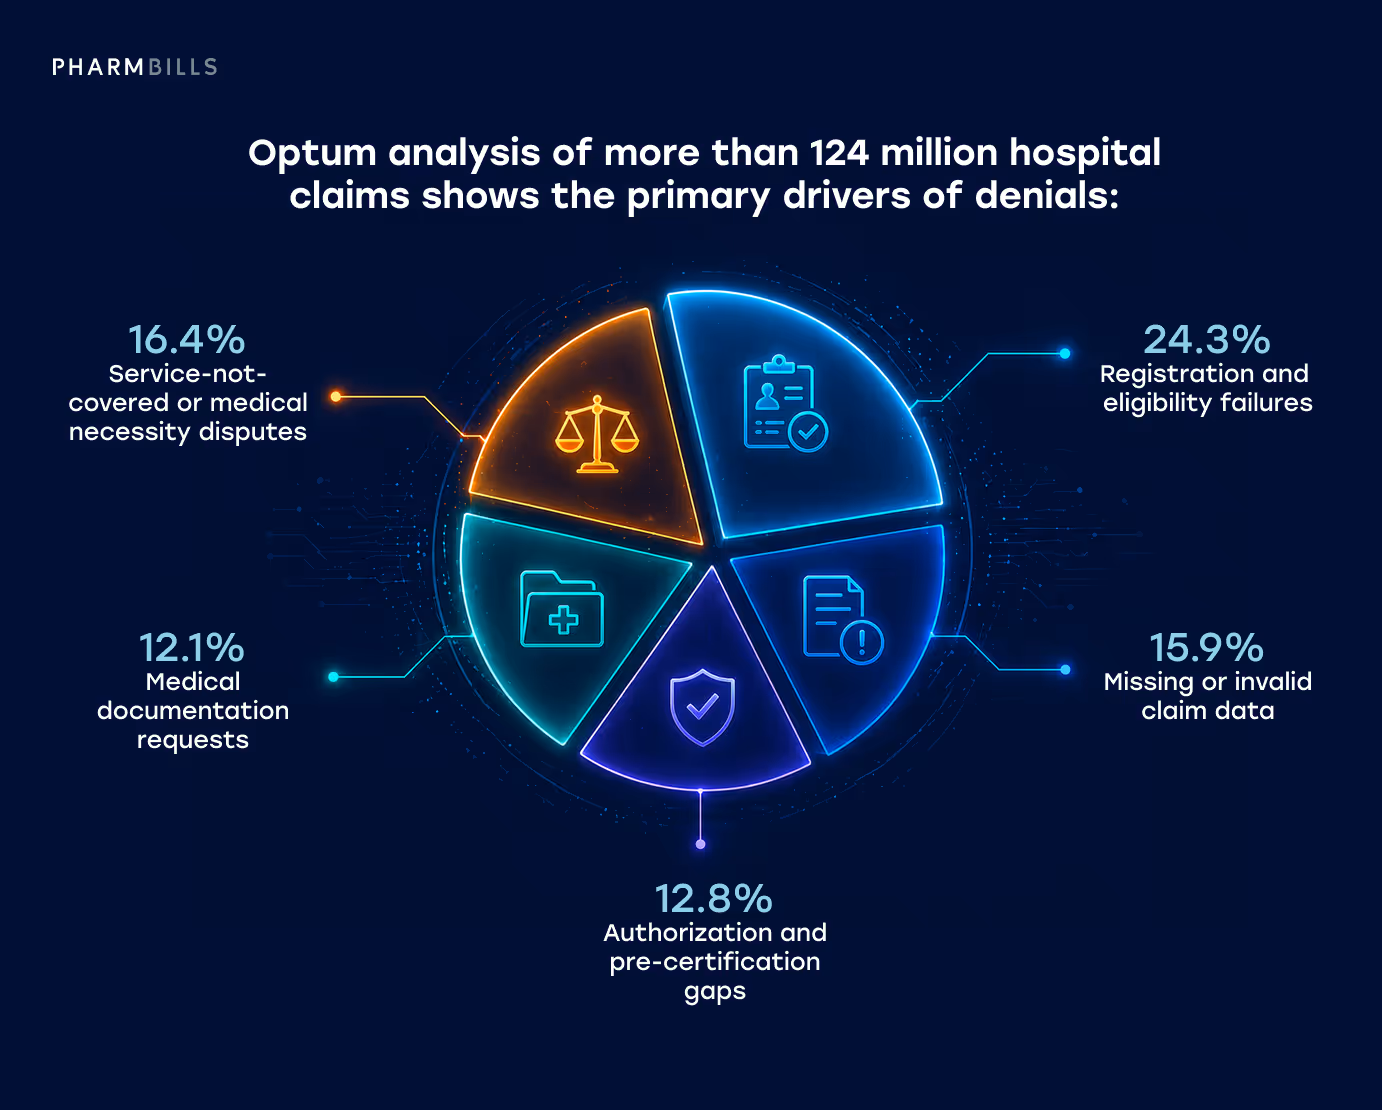
Optum analysis of more than 124 million hospital claims shows the primary drivers of denials:
- Registration and eligibility failures (24.3%)
- Missing or invalid claim data (15.9%)
- Authorization and pre-certification gaps (12.8%)
- Medical documentation requests (12.1%)
- Service-not-covered or medical necessity disputes (16.4% combined).
Approximately 44% of all denials originate from front-end revenue cycle failures, and industry experts classify 84% of all denials as potentially avoidable through stronger upstream processes.
A rising Initial Denial Rate signals systemic failures in point-of-service data capture, outdated clearinghouse rules, or aggressive new algorithms deployed by commercial and Medicare Advantage payers. It is one of the most actionable financial KPI tracking metrics in the entire cycle, because most denials are preventable rather than inevitable.
Net Collection Rate
The net collection rate (NCR) measures the percentage of expected reimbursement actually collected, calculated against the contracted amount after standard write-offs and adjustments. A healthy organization achieves 90% to 95%, while top-tier performers sustain 95% or higher.
NCR is the definitive measure of operational yield. Unlike gross collection rate, which compares collections against master-file gross charges and produces no actionable insight, NCR captures whether the organization is actually receiving the revenue it is contractually owed. A weak NCR typically signals:
- Unworked denials
- Silent underpayments by payers failing to honor fee schedules
- Missed secondary insurance billing
- Untimely filing write-offs
- Uncollected patient responsibility
Common pitfall: Treating gross collection rate as a proxy for NCR. It isn't — and tracking it instead of NCR is one of the easier mistakes to fix.
Patient Collection Rate
The patient collection rate is the core revenue cycle management KPI that measures how much of the patient's own financial responsibility (copays, deductibles, coinsurance, and self-pay balances) actually gets collected. As employers continue to shift premium costs onto employees through high-deductible health plans, patients now represent the third-largest payer class behind Medicare and Medicaid.
Unlike most other RCM metrics, this one does not have a single industry benchmark. Current data shows patient collection rates between 34% and 48%, with collection probability dropping below 17% for balances above $7,500. Time-of-service copay collections have fallen from 90% pre-pandemic to 56% in recent years. The realistic target is maximization through specific operational drivers, not a fixed percentage.

Three drivers reliably move this metric:
- Pre-service financial conversations boost point-of-service collections by 18% to 25%.
- Propensity-to-pay scoring focuses high-effort collection on viable accounts.
- Digital payment infrastructure removes friction from the patient experience.
A weak patient collection rate almost always points to gaps in pre-service price transparency, financial counseling, or payment workflow.
Cost to Collect
The cost to collect metric expresses RCM operating costs (patient access, billing, collections, coding, and direct RCM IT) as a percentage of net patient revenue. The industry target is between 2% and 4%, with best-in-class performers below 2% and broader industry averages between 3% and 5%.
Cost to collect is highly sensitive to human intervention. MGMA tracks a related metric called the Zero-Touch Rate — the percentage of claims paid without any human intervention. Across the industry, only about 40% of claims achieve zero-touch status, meaning the remaining 60% require manual rework. Each touch, such as denial investigation, payer phone call, and manual scrubbing carries a labor cost between $2.50 and $8.00.
High denial rates, manual front-end processes, and inefficient legacy clearinghouse rules force human capital into the workflow and inflate cost to collect. One of the most important revenue cycle management KPIs to watch closely, this metric directly connects RCM performance to operational efficiency.
A/R Over 90 Days
A/R over 90 days measures the percentage of total receivables aged beyond 90 days. It exists because average days in A/R alone hides aging tail risk. For example, a blended 35-day average can easily mask a portfolio where 70% of claims pay within 14 days, while 30% languish past 100.
HFMA MAP data sets the median for hospitals and health systems at 29.8%, with top performers achieving 20.9%. For physician practices, the median is significantly lower at 10.8%, with top performers at 7.9%.
A bloated 90+ day bucket is a severe diagnostic warning. Claims at this age rarely experience standard delays. They are usually complex clinical denials requiring peer-to-peer review, uncollectable patient balances, or claims trapped in repeated documentation requests. These claims are also at imminent risk of crossing payer timely-filing cutoffs, after which earned revenue becomes unrecoverable.
Deep Dive on RCM Audits
For a closer look at how RCM audits surface KPI breakdowns and revenue leakage points, read What is Audit in Healthcare Revenue Cycle Management (RCM): The Ultimate Guide to RCM Audits.
Supporting Metrics That Add Valuable Context
Supporting metrics add context to the primary indicators of revenue cycle health covered in the previous section. These supporting metrics don't replace the headline RCM KPIs, but they help explain why a primary metric is trending in a particular direction. Most are early-stage or workflow-specific indicators that surface root causes before they show up downstream.
The quick reference table below summarizes formulas, targets, and operational interpretation for the five most commonly tracked supporting RCM metrics, followed by more detailed explanations of each.
Timely Filing / Claim Submission Lag
Submission lag is a leading indicator for days in A/R. Charge entry slippage typically takes two to three weeks to surface in the A/R metric because claims have to age before the impact is visible. Watching submission lag directly closes that gap and gives leadership earlier warning of cash flow problems.
Persistent lag past five days usually points to clinical documentation bottlenecks, coder backlogs, or charge capture gaps. Timely-filing cutoffs vary by payer (Medicare allows 12 months, but some commercial plans run as tight as 90 days). So chronic delays don't just slow cash — they create permanent write-off risk on claims that age past the cutoff.
Eligibility Verification Rate
Eligibility verification is the highest-leverage front-end RCM performance metric. Registration and eligibility failures drive 24.3% of all denials, more than any other category. Unlike clinical denials, these are entirely preventable through pre-service workflow.
The 48-hour window matters. Verifying only at scheduling misses last-minute coverage changes; verifying only at check-in eliminates the chance to resolve issues before service. Best-in-class workflows verify at scheduling and re-verify within 48 hours.
Why weak performance hurts most: Eligibility-driven denials produce the worst category of bad debt — services already rendered, with no payer to bill and limited recourse for collection.
Denial Overturn / Appeal Success Rate
Appeal success measures back-end discipline. More specifically, it illustrates how effectively the team recovers revenue payers initially refused. The 60% target reflects what's achievable with consistent appeal templates, payer-specific argumentation, and disciplined filing timelines.
Filing speed is the bigger lever than appeal craft. Success rates drop to roughly 40% past the 60-day mark, mostly because supporting clinical documentation becomes harder to assemble and reviewing physicians have moved on from the original encounter.
One important framing: A high overturn rate combined with a high initial denial rate is a warning sign, not a win. It means the team is good at recovering revenue, but the front-end is generating preventable rework. Appeal success should never substitute for fixing what's causing the denials upstream.
Bad Debt Rate
Bad debt connects revenue cycle performance to actual cash recoverability. The 0.6% to 1.5% target range is wide because organizational mix matters. Large self-pay populations and high-deductible exposure push the upper bound, while well-insured commercial books trend lower.
The diagnostic value of revenue cycle KPIs comes from comparing trends across metrics. When bad debt rises while denial rates stay flat, the problem is patient-side: financial clearance gaps, weak pre-service price transparency, or absent payment plan options. When bad debt rises alongside denial rates, the problem is upstream: uncollectible balances are accumulating from claims that should have been adjudicated cleanly the first time.
Point-of-Service Collections
POS collections are the leading indicator for patient collection rate. Every dollar collected at the point of service is a dollar that doesn't enter aging buckets, doesn't generate statements, and doesn't accumulate Cost to collect overhead. This means collection probability drops sharply once balances move into post-service receivables.
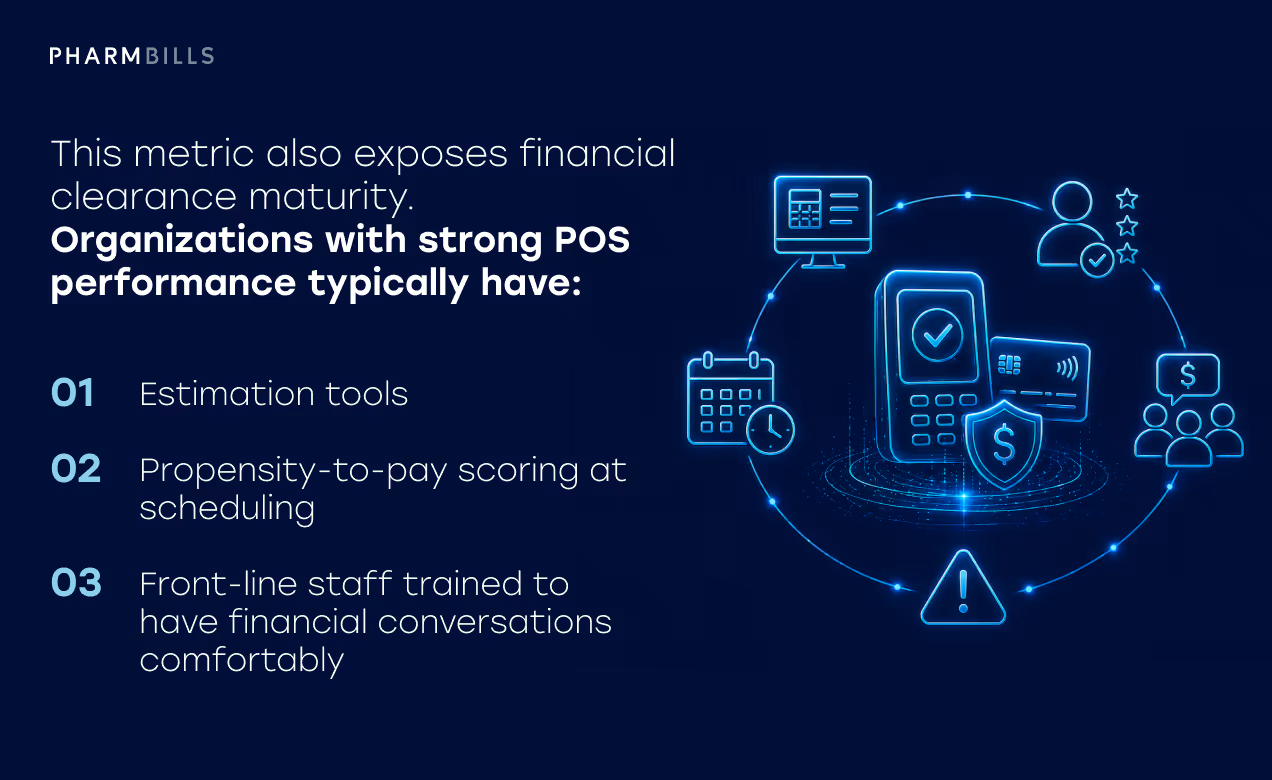
This metric also exposes financial clearance maturity. Organizations with strong POS performance typically have:
- Estimation tools
- Propensity-to-pay scoring at scheduling
- Front-line staff trained to have financial conversations comfortably
Weak POS performance usually traces to front-end workflows that treat payment as an optional follow-up rather than a service-day expectation.
How to Interpret RCM Metrics Instead of Just Reporting Them
Reporting revenue cycle management metrics and KPIs is not the same as understanding what it means. Any single KPI, read in isolation, can mislead. Composite analysis, which is achieved by analyzing two or three metrics together, reveals the real operational story behind the numbers.
Here are four metric combinations that experienced revenue cycle teams use to diagnose root causes:
- High denial rate + low clean claim rate = front-end intake collapse. When claims are failing clearinghouse scrubbers and getting denied at adjudication, the problem almost always lives at the front desk or in initial coding. The remedy is upstream: real-time eligibility verification, stricter pre-service financial clearance, and tighter scrubbing rules.
- Rising A/R days + stable denial rate = back-end processing delays. If Days in A/R and A/R over 90 days are climbing while initial denial rate stays flat, the cycle is not failing at the payer — it is failing in follow-up. This typically points to staffing shortages in the denials team, backlogs of unworked accounts, or a specific payer slowing down adjudication.
- Strong claim acceptance + weak net collection = revenue leakage. When claims pass cleanly but the organization collects only 85% of expected revenue, silent leakage is occurring. Common causes include underpayments relative to contracted rates, unbilled secondaries, inappropriate non-contractual write-offs by overwhelmed staff, and uncollectable patient deductibles.
- Rising patient balances + weak point-of-service collections = workflow and transparency gaps. When A/R is shifting toward patient responsibility while POS collections lag, the problem is upstream of any billing tool. The fix is pre-visit price estimation, stronger staff training in requesting payment, and modern payment infrastructure.
The pattern across all four combinations illustrates how revenue cycle problems are systemic, not single-metric. Effective revenue cycle analytics programs read KPIs in combination and trace performance issues to the workflow stage where they originated.
Benchmarks, Targets, and KPI Governance
Benchmark data is useful, but chasing generic national numbers blindly is a common path to misallocated effort. Benchmarks vary substantially by specialty, payer mix, organization type, and scale — and even when the right benchmark is identified, the governance scaffolding around how metrics are defined and owned matters as much as the metrics themselves.
Benchmarks Need Setting-Specific Calibration
Applying physician benchmarks to hospital RCM KPIs can produce alarmist reporting without diagnostic value. To illustrate, hospital A/R aging profiles run naturally longer than physician practices (DRG complexity, longer stays, and more involved pre-certification all add days). Furthermore, top-performing hospitals maintain about 29.8% of A/R over 90 days, while top-performing physician practices maintain 10.8%.
Specialty also matters. For example, MGMA analyses show primary care total medical revenue per physician rising 3.8%, while surgical specialties contracted 2.7% under tighter payer scrutiny on high-dollar procedures. So comparing a surgical group's collection performance against blended specialty averages obscures the real story.
Organizational type drives different calculation conventions entirely. Federally Qualified Health Centers (with sliding-fee scales and grant funding) need to align net collection rate calculations with HRSA UDS definitions, rather than commercial ambulatory targets. The math itself is different.
Internal Targets and Trend Discipline
Financial KPI tracking benchmarks define a credible performance range, but they shouldn't be confused with organization-specific internal targets. A practice running at 87% net collection rate shouldn't set 95% as next quarter's goal — it should set a realistic improvement increment relative to its current position. Targets too far ahead of reality become aspirational rather than operational, and teams stop trusting them.
Trend direction matters more than any single month's absolute number. A metric improving two percentage points per quarter on a clear trajectory is more valuable than one oscillating around a slightly better number.
Monthly snapshots also risk carrying too much noise, as payer batch timing, holiday closure effects, and single large claims can obscure genuine performance change. Quarterly trends are the more diagnostic view.
Definitional Consistency and KPI Ownership
The most common governance failure in revenue cycle reporting is inconsistent metric definitions. When the patient access team, the coding department, and the CFO each calculate denials using different methodologies, strategic alignment becomes impossible, and every revenue cycle management KPI tracked downstream loses meaning.
The HFMA Claim Integrity Task Force has published rigorous standards on this point, specifically distinguishing between claim-level and line-level denial reporting.
- Claim-level reporting counts the first chronological denial on a claim. Useful for executive trending, but it can flag an entire $10,000 surgical encounter as "denied" because of a $50 lab test rejection.
- Line-level reporting evaluates denials at the specific CPT or HCPCS code, weighted by gross charges. This is the operational standard for root-cause analysis, because it isolates whether an entire episode was denied or just one line item bundled inappropriately.
Leading organizations enforce strict data dictionaries so every dashboard (from C-suite reporting to frontline billing queues) uses identical definitions, inclusions, and exclusions. The discipline isn't glamorous, but it's what makes governance credible across the organization.
KPI ownership should be assigned explicitly. Each metric needs a named owner responsible for trend direction, root-cause analysis when the metric drifts, and the operational levers that move it. Without explicit ownership, KPIs default to passive observation rather than active management.
What a Modern Revenue Cycle KPI Dashboard Should Show
A modern revenue cycle KPI dashboard is built around action, not retrospection. Static monthly reports of high-level metrics, what KLAS researchers have described as "executive vanity metrics," are no longer sufficient. The bar for current best-practice dashboards has moved considerably higher.
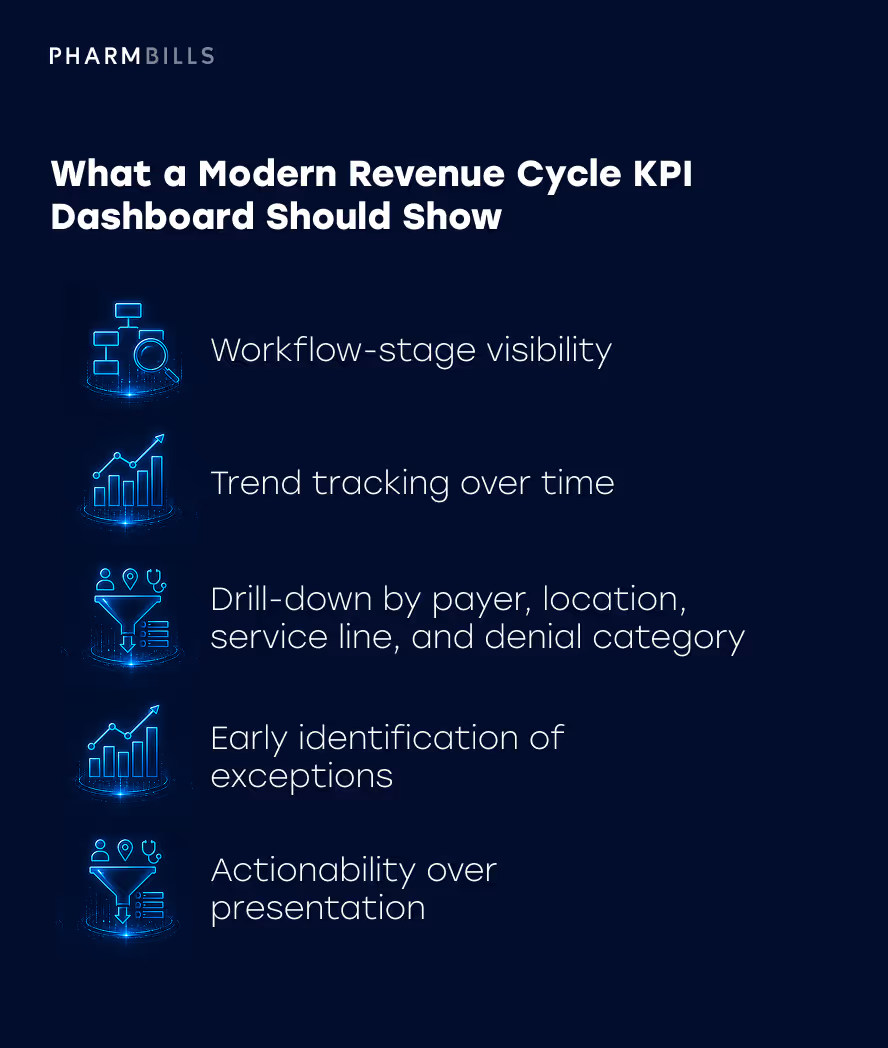
A useful dashboard should enable the following:
- Workflow-stage visibility. Performance broken out by patient access, claims, denials, A/R, and financial outcomes — not just bottom-line totals.
- Trend tracking over time. Direction matters as much as absolute value. A 95% clean claim rate trending downward is a different story than 95% trending up.
- Drill-down by payer, location, service line, and denial category. Averages hide the specifics that drive corrective action. Segmentation is non-negotiable.
- Early identification of exceptions. Proactive alerts when a specific payer's adjudication time deviates from baseline, or when a sudden spike in coordination-of-benefits denials appears at one clinic.
- Actionability over presentation. A dashboard's purpose is to trigger intervention, not to look impressive in a quarterly review.
The technology behind these dashboards has matured rapidly, with KLAS Research tracking the industry's shift from basic digitization toward optimization and embedded analytics. But technology alone is not the answer.
A dashboard is useful when supported by clear ownership, disciplined definitions, and people who know how to act on the signals it surfaces. RCM performance metrics become valuable financial health indicators only when paired with the workflow discipline to do something about them.
More Information
For a closer look at how to evaluate whether a vendor or partner can support this level of reporting maturity, see 16 Important Questions to Consider Before Choosing an RCM Vendor.
Common Mistakes in Revenue Cycle KPI Tracking
Even organizations with strong KPI programs run into recurring failure patterns. The mistakes below are surprisingly consistent across hospitals, group practices, and ambulatory specialty providers. Recognizing them is often the first step toward fixing them.
- Tracking too many metrics with no prioritization. Monitoring fifty disparate data points produces analytical paralysis, not insight. Effective programs prioritize a small number of core KPIs, assign explicit ownership for each, and resist the temptation to expand the dashboard every quarter.
- Focusing exclusively on lagging indicators. Days in A/R and bad debt report financial damage weeks after the operational failure occurred. Mature programs balance these with leading indicators like eligibility verification rate, daily POS collections, and claim submission lag that predict cash flow before it materializes.
- Using inconsistent definitions across teams. When the front office calculates denial rate one way and the CFO uses another, accountability dissolves. This is one of the most pervasive failures in healthcare financial management, and the fix is shared data dictionaries that are enforced organization-wide.
- Reviewing KPIs too infrequently. Monthly reviews are not fast enough for metrics that drive operational decisions. Daily or weekly cadences for front-end and denial metrics let teams course-correct before issues become structural.
- Relying on averages without segmentation. A 10% average denial rate hides the fact that one commercial payer may be denying at 25% while Medicare denies at 4%. Segmenting by payer, location, and provider exposes targeted opportunities for improvement.
- Reporting metrics without action plans. A dashboard that displays red RCM KPIs without triggering tasks or formal interventions reduces tracking to an academic exercise. Every metric should be tied to a clear escalation path.
- Celebrating appeal wins while ignoring the root cause. A high denial overturn rate is positive, but treating appeals as the success metric ensures the organization keeps absorbing the cost of preventable denials. The strategic priority is denial prevention upstream, not appeal volume downstream.
Avoiding these patterns is what separates RCM performance improvement programs that genuinely move the needle from those that produce attractive reports without changing operational outcomes.
How Better KPI Visibility Supports Revenue Cycle Improvement
Disciplined revenue cycle KPI tracking is the foundation for sustained revenue cycle improvement. When the right metrics are tracked, segmented, interpreted, and acted on, several outcomes follow consistently:
- Preventable denials decline. Organizations that segment denial data by root cause and payer typically identify the top three or four drivers of avoidable rejections within the first audit cycle. Fixing those drivers upstream produces compounding improvements.
- Collections and follow-up improve. Better visibility into A/R aging and claim status surfaces stuck accounts faster, before timely-filing cutoffs are breached. Follow-up effort gets directed to the accounts most likely to be recoverable.
- Workflow bottlenecks become visible earlier. A submission lag spike in one location, an eligibility verification dip in one specialty, a sudden rise in POS collection drop-off — all of these surface days or weeks earlier with proper KPI infrastructure than with only monthly retrospectives.
- Accountability strengthens. When KPI ownership is explicit and definitions are consistent, internal teams and external partners alike understand exactly what they are responsible for and how performance will be measured.
- Operational decisions get smarter. Capacity planning, staffing decisions, technology investments, and partner evaluations all improve when the underlying data is reliable and segmented.
This is also where the right operational support makes a measurable difference. Whether tracked internally or with the help of an outsourced RCM partner, the value comes from the discipline and expertise applied to the numbers, not from the technology surrounding them. Healthcare revenue optimization depends on consistent execution, not just better reporting.
More Information
For a broader perspective on revenue cycle improvement strategies, see Maximizing Profits: Strategies for Healthcare Revenue Cycle Optimization in 2026.
Summing Up: RCM Metrics and KPIs
The most useful revenue cycle management metrics are those that show with specificity and speed, exactly where revenue is slowing down, leaking out, or becoming harder to collect. These are the metrics tracked because someone will act on them, not because the dashboard had a slot to fill.
Meaningful KPI tracking in 2026 is less about adding metrics to the dashboard and more about doing the work behind each one. This involves defining KPIs consistently, segmenting them by payer and workflow stage, interpreting them in combination, and tying every red number to a specific action plan. The healthcare organizations doing this well are not necessarily using more sophisticated technology than their peers; they are applying more operational discipline to the data they already have.
If your current dashboards aren't translating into faster denial resolution, cleaner front-end workflows, and more predictable collections, the issue may not be the metrics — it may be the discipline behind them. Contact our RCM specialists for expert support in evaluating whether your revenue cycle management KPIs are actually driving operational decisions, or simply documenting them.